AR-WAM: Efficient Streaming World-Action Modeling for Autonomous Driving
Toyota Motor North America R&D - InfoTech Labs


Toyota Motor North America R&D - InfoTech Labs
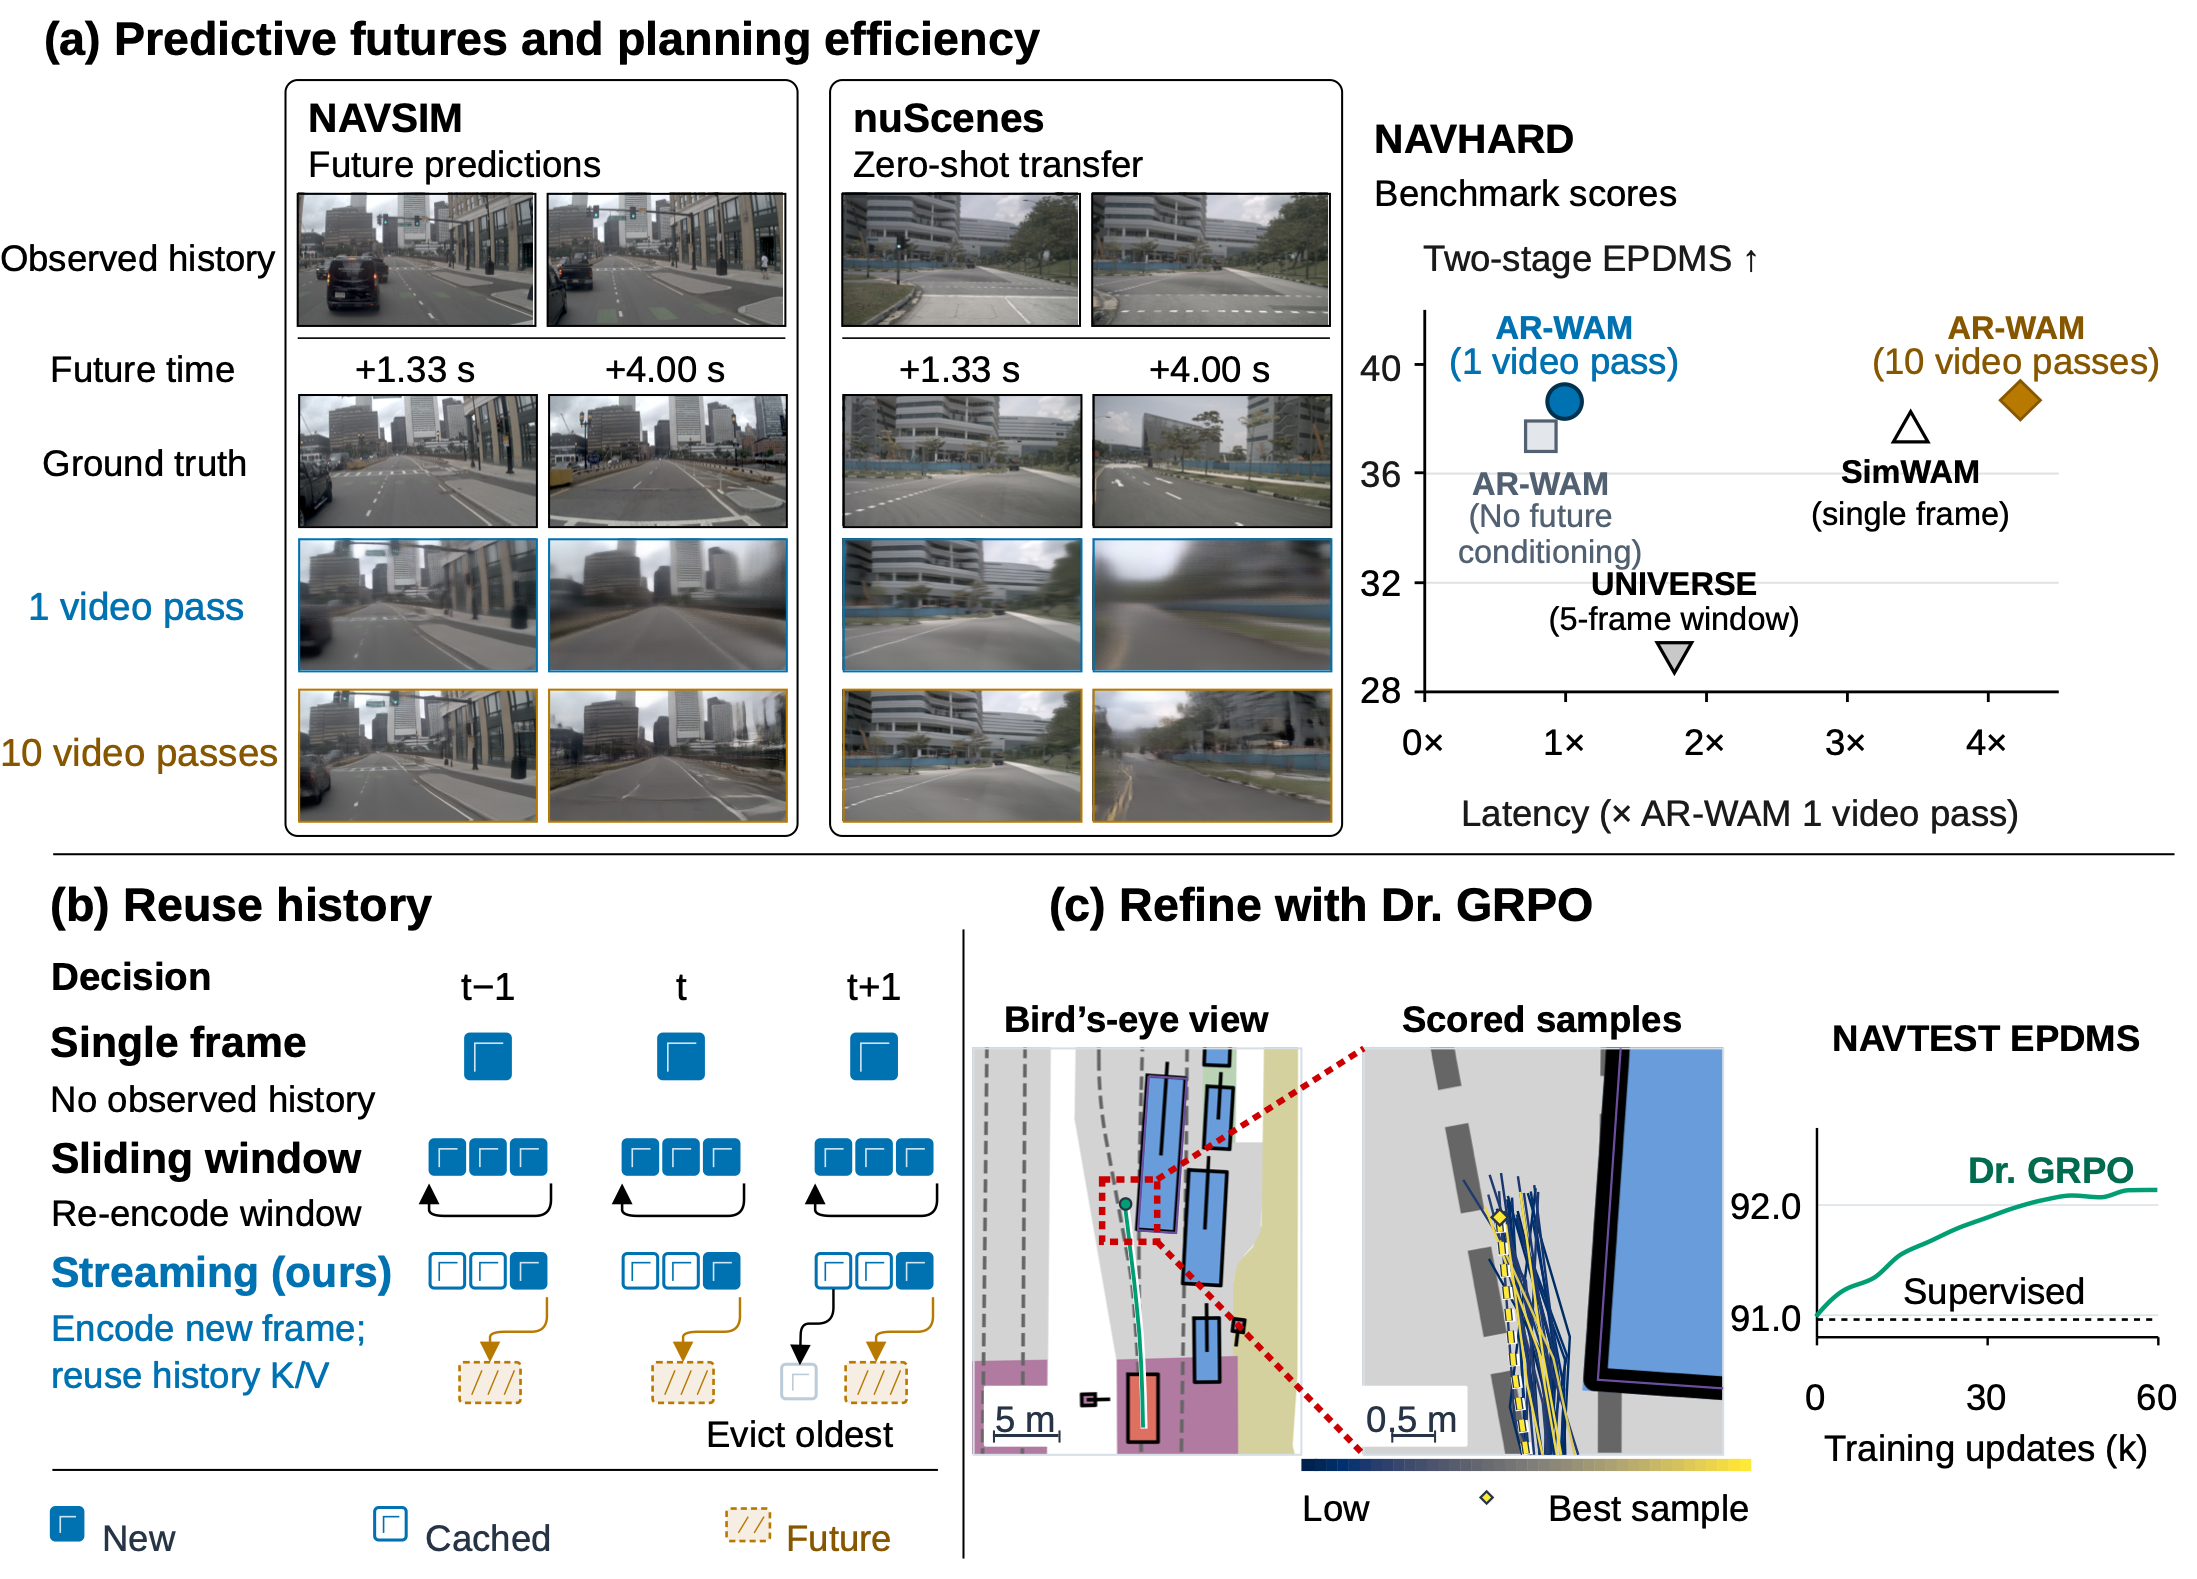
Autonomous driving requires anticipating how traffic will evolve while responding quickly to new observations. Video foundation models offer the first ability, but repeated history encoding and iterative video generation make them costly to use for driving. We present AR-WAM, an efficient streaming world-action model that combines autoregressive temporal modeling with single-pass future conditioning. Because its video backbone is causal, AR-WAM updates its visual context incrementally, reusing past computation and conditioning future prediction on observed motion. We further hypothesize that future features computed from recent observations can improve generalization in dynamic traffic without iterative video generation. AR-WAM therefore obtains these features in one forward pass and uses them to condition trajectory generation, and reinforcement learning then improves the policy through direct optimization of driving rewards. With a single front camera, AR-WAM achieves 91.5 PDMS after supervised training and 94.0 after reinforcement learning on NAVSIM-v1, outperforming the compared strong end-to-end world-action models. In a dynamic setting of continuous driving, supervised AR-WAM keeps its visual history across decisions and outperforms strong world-action baselines.
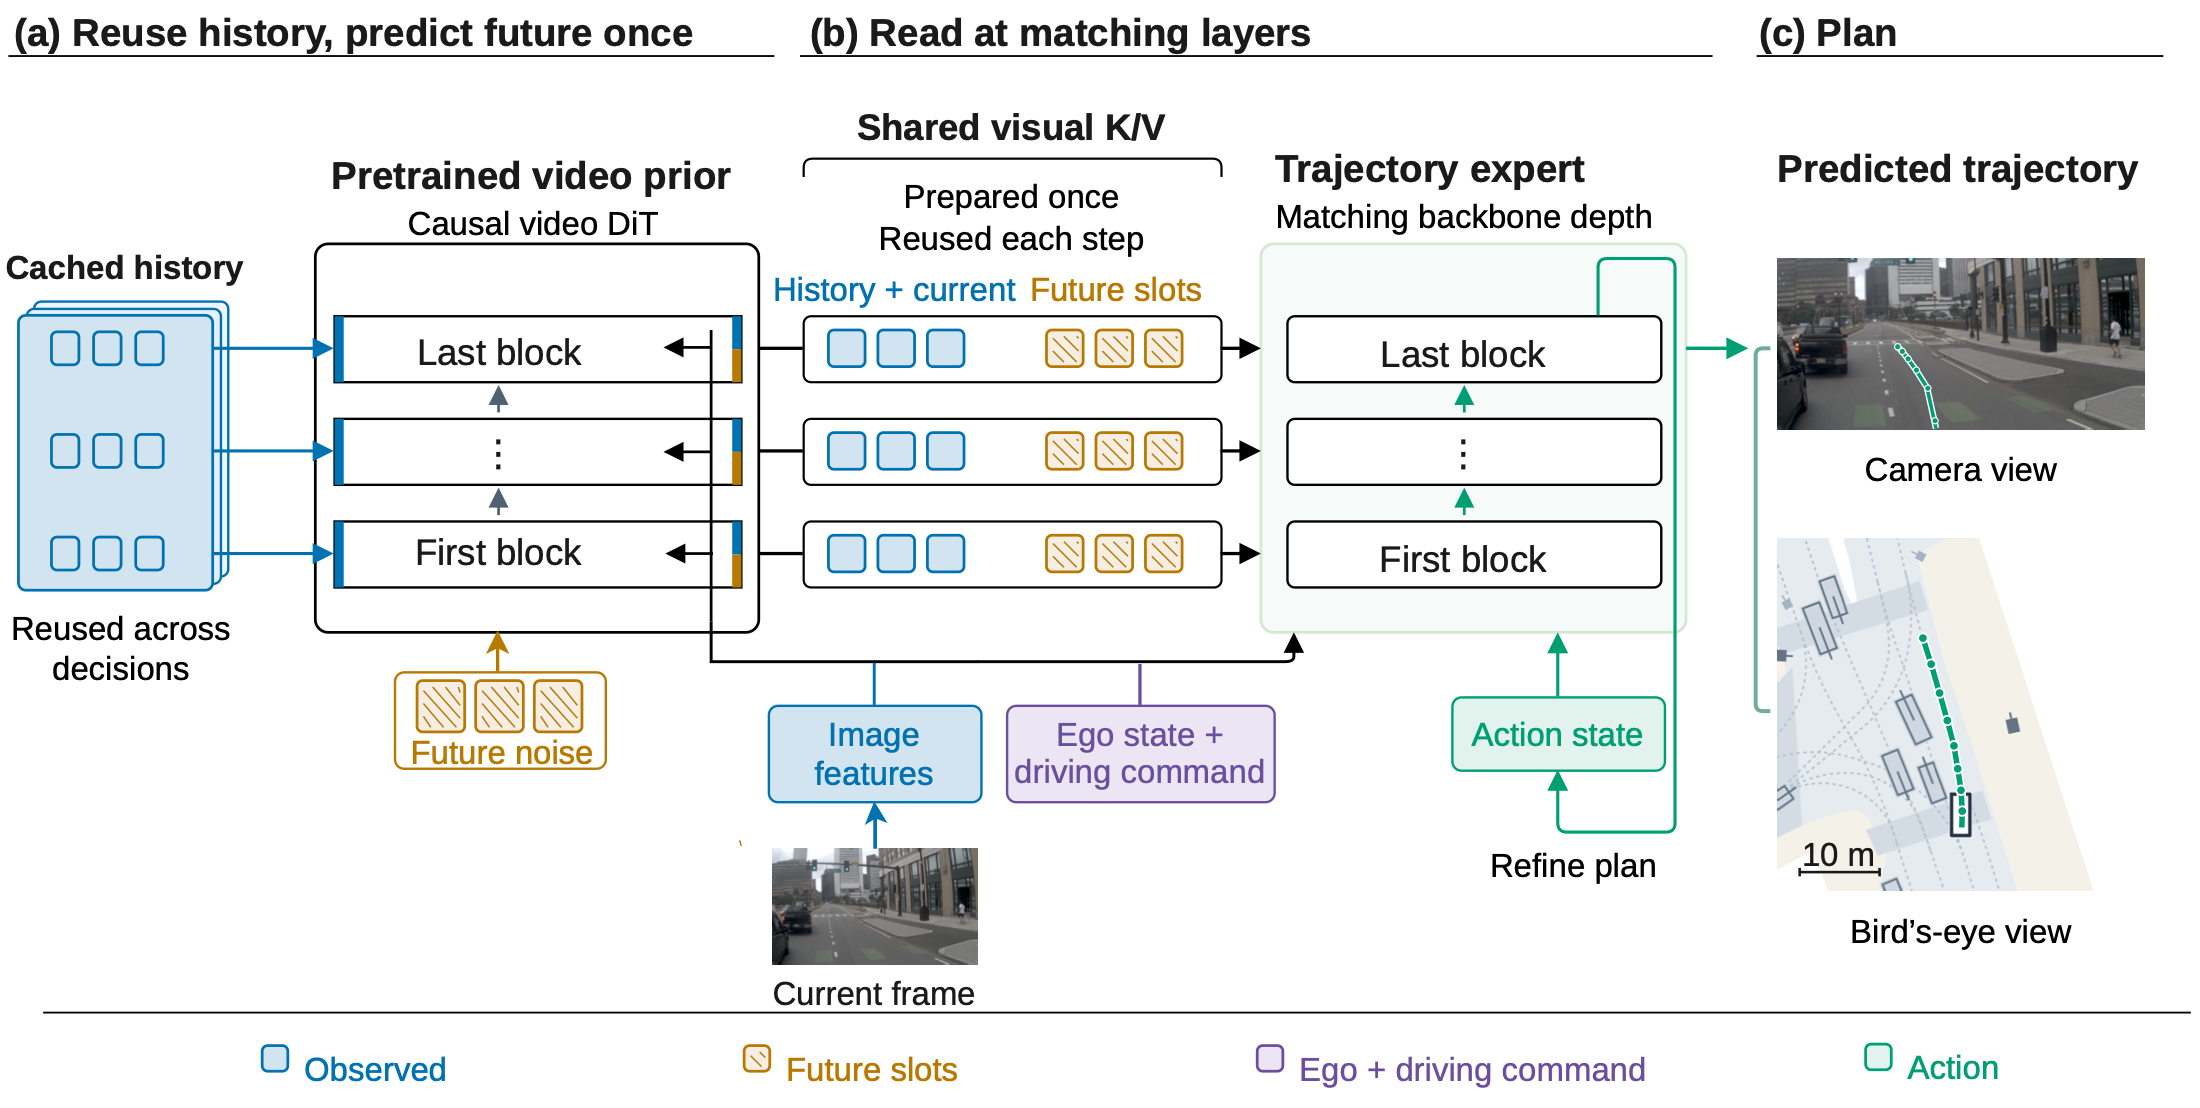
Cached visual history. A policy that re-encodes a window of recent frames repeats most of its visual computation at every decision. AR-WAM keeps its observation history in the causal form of its backbone, a pretrained causal video diffusion transformer. Because a frame never depends on later ones under causal attention, the attention keys and values (K/V) of earlier frames are computed once, cached and reused. A sliding window bounds the cache, and only the newest, incomplete chunk is recomputed when a frame arrives, so memory and per-decision work stay bounded however long the stream runs.
One predictive pass per decision. Generating future video by iterative denoising multiplies the backbone cost of each decision. AR-WAM instead runs one backbone pass over the current frame and future slots left at pure noise, attending to the cached history (a). Because the backbone is trained to predict future video, this pass yields prediction-trained features without generating video. The ego state and driving command change at every decision, so they enter only this pass and the trajectory expert, which keeps the cache valid as driving intent changes.
Layerwise trajectory expert. The trajectory expert has one block per backbone block. At each depth, its action tokens attend to the keys and values of the cached history and of the predictive pass, together with higher-resolution features of the current image and the ego state and driving command (b). This attention is decision-relative: only the expert's own positions are shifted, so it sees the same relative positions however long the stream has run, no cached key is modified, and the same weights apply at the start of a stream and deep into a long one. The expert generates the trajectory by flow matching and reuses the decision's visual K/V at every integration step.
Joint training and reward refinement. The backbone and the trajectory expert are trained jointly with two flow-matching losses, one on the trajectory and one on future video. Reinforcement learning then improves the policy through direct optimization of driving rewards. Because the visual pass does not depend on the trajectory, each scene needs one frozen pass, shared by all sampled plans and policy updates. Group-relative advantages are commonly divided by the standard deviation of the rewards in their group. With rule-based driving scores this is a poor fit, because nearly tied groups are the norm, so AR-WAM removes the division, as Dr. GRPO does, and trains on a mix of mined hard scenes and ordinary scenes with one shared reward scale.
We compare the single predictive pass with two alternatives. In the no-future variant, the trajectory expert reads only the observed history and the current latent, although the backbone is still trained to predict future video, as in current-frame WAMs that drop future tokens at inference. In the clear-future variant, AR-WAM's own weights denoise the future video jointly with the action, so the last action steps read an almost clean predicted future at the cost of one backbone pass per action step.
| Future | PDMS ↑ | EPDMS ↑ | L2 ↓ | Passes | Latency |
|---|---|---|---|---|---|
| No future | 91.5 | 37.3 | 0.87 | 1 | 0.8× |
| One pass (AR-WAM) | 91.5 | 38.6 | 0.87 | 1 | 1.0× |
| Clear future | 91.5 | 38.8 | 0.88 | 10 | 4.2× |
Future modeling at inference. PDMS: NAVTEST; EPDMS: NAVHARD two-stage; L2: nuScenes zero-shot average in metres; Passes: backbone world passes per decision; Latency: median per decision relative to one pass, which takes 146 ms on an H200. Bold: best result in each column.
Test-time future prediction improves decisions at a small cost in latency. One predictive pass raises EPDMS on the perturbed two-stage scenes of NAVHARD by 1.3 over the no-future variant, with unchanged NAVTEST and nuScenes accuracy, while latency grows only from 0.8× to 1.0×. Denoising a clear future adds a further 0.2 EPDMS but takes more than four times as long, so one pass recovers most of its benefit at under a quarter of the latency.
Each standard NAVTEST query rebuilds the policy's history from four frames, so it cannot measure the effect of history carried across decisions. We therefore also evaluate a dynamic setting in which each policy runs through 138 full NAVTEST source logs in chronological order (69,711 frames at 2 Hz) and keeps its history across frames. Observations come from the logs and do not depend on the predicted actions. Plans are scored with one-stage EPDMS, including extended comfort (EC) between consecutive plans. Full logs keep the frames in which the vehicle is waiting, which NAVSIM largely leaves out of NAVTRAIN and NAVTEST, so to compare policies on the benchmark's scene distribution we score the 47,220 non-waiting frames.
| Method | Hist. | Latency (ms) | NC | DAC | DDC | TLC | EP | TTC | LK | HC | EC | EPDMS |
|---|---|---|---|---|---|---|---|---|---|---|---|---|
| SimWAM | 1 | 499.1 | 98.0 | 99.1 | 99.4 | 99.5 | 88.0 | 98.2 | 98.1 | 98.7 | 87.2 | 90.4 |
| UNIVERSE | 5 | 256.9 | 98.5 | 99.0 | 99.5 | 99.8 | 87.8 | 98.7 | 97.9 | 98.6 | 64.5 | 88.3 |
| DriveVA | 5 | 258.8 | 98.5 | 99.0 | 99.5 | 99.8 | 87.7 | 98.6 | 98.2 | 98.5 | 57.4 | 87.4 |
| DriveWAM | 1 | 895.7 | 98.0 | 99.1 | 99.4 | 99.4 | 88.3 | 98.1 | 98.3 | 98.7 | 91.8 | 90.9 |
| AR-WAM, current frame | 1 | 106.9 | 98.2 | 99.1 | 99.5 | 99.7 | 88.0 | 98.3 | 98.5 | 98.7 | 84.8 | 90.7 |
| AR-WAM | 5 | 146.3 | 98.7 | 99.1 | 99.5 | 99.6 | 88.0 | 98.8 | 98.8 | 98.7 | 88.0 | 91.5 |
| AR-WAM + RL, EPDMS | 5 | 132.8 | 98.7 | 99.6 | 99.5 | 99.5 | 88.6 | 98.9 | 98.0 | 98.7 | 89.9 | 92.2 |
Dynamic setting. The 47,220 non-waiting frames of 138 NAVTEST logs, run in order at 2 Hz with a persistent history cache. Columns are one-stage NAVSIM-v2 sub-scores. Hist.: camera frames used per decision. Latency: median per decision at batch size one on an H200. Current frame: AR-WAM retrained without visual history. Bold: best result in each column.
AR-WAM outscores all four baselines and runs faster. Its lead over SimWAM, which replans from the current frame, comes mainly from fewer at-fault collisions and time-to-collision violations, and visual memory accounts for most of it: the current-frame variant falls between the two, closer to SimWAM. This memory costs about 40 ms per decision. Refinement with the EPDMS reward raises both EPDMS and extended comfort further.
UNIVERSE re-encodes its five-frame window at every decision, whereas AR-WAM encodes only the newest frame and reuses its cache. With the same five frames, AR-WAM is 1.8 times faster than UNIVERSE and DriveVA in median latency, although it also computes predictive features. It is 3.4 times faster than SimWAM, which plans from the current frame with ten flow steps, and 6.1 times faster than DriveWAM.
AR-WAM is trained on all 103,288 NAVTRAIN scenes with one front camera. We report NAVSIM-v1 PDMS and its components, NAVSIM-v2 EPDMS and the two-stage NAVHARD score on the 12,146 NAVTEST and 5,912 NAVHARD scenes. Direct methods output one trajectory per decision; proposal-scoring methods select one of up to 64 candidates with a scorer trained on PDM sub-scores.
| NAVTEST, NAVSIM-v1 | NAVTEST | NAVHARD | ||||||||
|---|---|---|---|---|---|---|---|---|---|---|
| Method | Ref. | Cam. | NC | DAC | TTC | Comf. | EP | PDMS | EPDMS | EPDMS |
| Reference planners without a world model | ||||||||||
| Human driver | – | – | 100.0 | 100.0 | 100.0 | 99.9 | 87.5 | 94.8 | – | – |
| DiffusionDrive | CVPR'25 | 3+L | 98.2 | 96.2 | 94.7 | 100.0 | 82.2 | 88.1 | – | – |
| ReCogDrive† | ICLR'26 | 1 | 97.9 | 97.3 | 94.9 | 100.0 | 87.3 | 90.8 | – | – |
| DrivoR‡ | CVPR'26 | 4 | 98.9 | 98.3 | 96.2 | 100.0 | 89.1 | 93.1 | – | 48.3 |
| World-action models, direct prediction, supervised | ||||||||||
| Epona | ICCV'25 | 1 | 97.9 | 95.1 | 93.8 | 99.9 | 80.4 | 86.2 | – | – |
| DriveVLA-W0 | ICLR'26 | 1 | – | – | – | – | – | – | 86.1 | 24.4 |
| PWM | NeurIPS'25 | 1 | 98.6 | 95.9 | 95.4 | 100.0 | 81.8 | 88.1 | – | – |
| DriveLaW | CVPR'26 | 1 | 99.0 | 97.1 | 96.7 | 100.0 | 81.3 | 89.1 | 88.6 | 30.6 |
| DriveWAM | NeurIPS'26 | 1 | 98.3 | 98.1 | 95.2 | 100.0 | 84.3 | 90.1 | – | – |
| SimWAM, Wan2.2 | arXiv | 1 | 98.6 | 98.0 | 95.8 | – | 84.0 | 90.3 | 90.2 | 37.6 |
| DriveVA | ECCV'26 | 1 | 99.0 | 97.3 | 98.4 | 100.0 | 83.2 | 90.5 | – | – |
| GeoWAM | arXiv | M | – | – | – | – | – | – | 90.7 | 39.6 |
| SUV | arXiv | 1 | 99.1 | 97.8 | 96.7 | 100.0 | 84.6 | 90.8 | 91.0 | 36.9 |
| UNIVERSE | NeurIPS'26 | 1 | 99.1 | 97.6 | 98.5 | 100.0 | 83.6 | 91.0 | – | – |
| WA-JEPA | arXiv | 4 | 99.5 | 98.3 | 97.7 | 100.0 | 85.0 | 91.8 | 91.7 | – |
| World-action models, post-trained or proposal scoring | ||||||||||
| SimWAM, Wan2.2† | arXiv | 1 | 98.5 | 99.1 | 96.1 | 99.8 | 86.5 | 91.9 | – | – |
| SimWAM, Cosmos2.5† | arXiv | 1 | 98.8 | 99.2 | 96.4 | – | 87.0 | 92.4 | – | – |
| DA-WAM‡ | arXiv | 1 | 99.1 | 98.9 | 96.8 | 99.8 | 90.0 | 93.7 | 89.2 | – |
| AR-WAM | 1 | 99.4 | 98.2 | 98.0 | 100.0 | 84.5 | 91.5 | 90.9 | 38.6 | |
| AR-WAM + RL, PDMS† | 1 | 99.0 | 99.3 | 96.1 | 100.0 | 90.7 | 94.0 | – | – | |
| AR-WAM + RL, EPDMS† | 1 | 99.3 | 99.3 | 97.1 | 100.0 | 86.6 | 92.7 | 92.2 | 42.3 | |
Comparison on NAVTEST and NAVHARD. Baseline values are publication-reported. Cam.: cameras (L: LiDAR; M: multiview). †: reward post-training. ‡: proposal scoring. Bold: best result in each column, not counting the human driver and ‡ rows.
Among the compared supervised direct methods, AR-WAM has the highest NAVSIM-v1 PDMS with a single camera, and only the four-camera WA-JEPA scores higher. Its NAVSIM-v2 EPDMS is within 0.1 of the best supervised single-camera result. With the PDMS reward, AR-WAM reaches 94.0 PDMS, above every direct method and above the proposal-scoring DA-WAM and DrivoR. With the EPDMS reward, EPDMS rises from 90.9 to 92.2 on NAVTEST and from 38.6 to 42.3 on NAVHARD, the best NAVSIM-v2 scores among direct methods on both.
To test transfer beyond NAVSIM, we apply AR-WAM to nuScenes without fine-tuning, following DriveVA's evaluation protocol on 4,519 samples from 150 validation scenes. SimWAM, UNIVERSE, DriveVA and DriveWAM are evaluated on the same samples, together with a constant-velocity reference. The table also separates the waiting samples, in which the logged vehicle moves less than 1 m within 3 s. NAVSIM's training protocol removes most scenes in which the vehicle stands still, so the non-waiting samples correspond to the kind of scenes AR-WAM is trained on.
| All samples | Non-waiting | Waiting | |||||||
|---|---|---|---|---|---|---|---|---|---|
| L2 | Col. | L2 | Col. | L2 | Col. | ||||
| Method | 1 s | 2 s | 3 s | Avg. | Avg. | Avg. | Avg. | Avg. | Avg. |
| Constant velocity | 0.33 | 1.13 | 2.34 | 1.27 | 0.47 | 1.46 | 0.54 | 0.15 | 0.06 |
| SimWAM | 0.29 | 0.83 | 1.77 | 0.97 | 0.05 | 0.94 | 0.05 | 1.12 | 0.05 |
| UNIVERSE | 0.30 | 0.75 | 1.44 | 0.83 | 0.07 | 0.91 | 0.08 | 0.37 | 0.01 |
| DriveVA | 0.34 | 0.79 | 1.48 | 0.87 | 0.10 | 0.97 | 0.08 | 0.30 | 0.20 |
| DriveWAM | 0.27 | 0.77 | 1.68 | 0.91 | 0.03 | 0.88 | 0.03 | 1.08 | 0.01 |
| Adaptive-WAM | 0.35 | 0.71 | 1.58 | 0.88 | 0.08 | – | – | – | – |
| AR-WAM | 0.24 | 0.73 | 1.63 | 0.87 | 0.05 | 0.88 | 0.04 | 0.82 | 0.14 |
NAVSIM-to-nuScenes transfer. Lower is better. L2 is in metres; Col. is the horizon-averaged collision percentage. The Adaptive-WAM row is publication-reported; the others are our evaluations on 4,519 samples. Of the 4,437 samples with all horizons, 635 are waiting. Bold: best result in each column.
On the non-waiting samples, AR-WAM and DriveWAM transfer best, with the lowest L2 error and about half the collision rate of UNIVERSE and DriveVA. Over all samples, including the 14% of waiting samples that its training largely excludes, AR-WAM stays close to UNIVERSE (0.87 versus 0.83 m average L2), matches DriveVA and has the lowest one-second error.
@article{luo2026arwam,
  title={AR-WAM: Efficient Streaming World-Action Modeling for Autonomous Driving},
  author={Luo, Baiting and Mishra, Shatadal and Moradipari, Ahmadreza and Ammar, Nejib},
  journal={arXiv preprint},
  year={2026}
}